Common analytics discrepancies

Ads Manager
Why can't I see any data for my campaigns within Ads Manager?
Campaign metrics will only show in ads manager if a campaign delivered in the selected date range. By default, your ads manager only shows the last seven (7) days of activity. You can adjust the date range view by selecting your desired date range in the top right corner of your dashboard. You will then be able to view the campaigns and metrics that fall into that date range.
Learn about possible reasons your campaigns aren't receiving impressions.
Why doesn’t the top-level data match the sum of all individual line items, including keywords, language, etc?
Keyword targeting
Often when viewing a data breakdown by keyword, you’ll see that the campaign-level summary of all impressions, engagements, or spend is much lower than the sum of all the keywords listed below as line items. This is because there is a certain degree of overlap between keywords, which can occur when a single query or post includes multiple targeted keywords.
For example, if you targeted the keywords "sun" and "#sunnyday", and someone posted "Can't wait for the sun! #Sunnyday", the ad impression served to them would appear once next to "sun" and once next to "#sunnyday" in your ads manager campaign analytics for keywords.
Interest, language, and follower targeting
When viewing your campaign by interest, language, and follower targeting, you'll usually see a lower number of total impressions, engagements, or spend on the top line campaign level than when you add up all of the individual ones listed below. This is because if someone views your campaign and fits into multiple categories, their engagement and impression will be counted under both.
For example, if you target people who have the interest of "comedy", they may also have interests in "cooking" and "fashion". The interests "cooking" and "fashion" will show up in your ads dashboard, but only because they also have the interest that you targeted, which is "comedy". Your ads will not be served to people who don't have the interests you have implemented in your campaign. The dashboard shows a breakdown of other interests and languages that they have, in addition to the ones you've targeted. You're only charged once, and if they are within your targeting parameters.
Learn why top-line metrics aren't matching up for your follower campaign.
Why does the spend for individual campaigns not add up to the top-line sum?
Due to the real-time nature of our ad platform and the different ways our billing system and ad server count your campaign performance, there is potential for discrepancies between what you see on your campaign dashboards and what we log internally. The spend in the Ads UI and the billing system should match up after 36 hours.
Why do my videos show higher completion rates than video views?
Video views are defined as 50% in view for 2 seconds or more. However, our quartile metrics (25%, 50%, 75%, 100%) do not consider any percentage in-view. This means that someone can hit quartile metrics even if they don't have 50% of your video in-view. Due to this, it's possible that people hit a "video completion" without hitting a "video view". This is especially common for shorter video creatives.
Why is my spend higher than my daily budget?
App installs and app re-engagements campaigns
Our app installs and app re-engagements campaigns always bill on a 30-day post-engagement / 1-day post-view attribution window. However, the ads manager allows you to customize your mobile app tracking attribution events, and will show your data according to whichever window you set.
Other campaign objectives
If you lower your campaign's daily budget over the course of the day, keep in mind that day's spend might be higher than your new lower daily budget.
For example, if your campaign begins serving for the day with a daily budget of $30, but you lower the budget to $15 during the day, it's possible your campaign's spend for the day will be higher than $15. However, the next day, your campaign will not spend more than $15.
Why do certain posts have more impressions than others?
X Ads will automatically optimize which posts serve most often in your campaign based on their chance of engagement. X uses "ad score" for each post to know how likely someone is to engage with your ad, and will serve higher-ranked posts more frequently in your campaign. This is why you may see higher impressions for certain posts in your campaign results.
We recommend having at least 3 posts per campaign, and no more than 7-10. Learn more about how to optimize your campaigns.
Why don't my link click metrics match that of a third-party platform?
Your ads manager reports "link clicks" according to the number of times someone on X clicks on a link in your post. This is logged as soon as the click action happens.
In third-party analytics platforms, you will receive reporting on the number of times that unique users land on your webpage and stayed long enough for the page to load completely (triggering their analytics tracking code).
This is what drives the difference between the two numbers you are seeing. This can vary based on:
- Load time - for example, on slow cell networks, it may take longer for the link to request and page to load, so users may exit out before the webpage fully loads.
- Intent - users may click on an image but exit out when they realize a website is loading.
To improve these numbers, we recommend testing different creative formats, including:
- Picture + link in post copy - try adding an image and a link in your post copy, instead of using Website Buttons. This has increased link click intent in certain cases.
- Only a link in post copy - try using just a link in your post copy. This too has resulted in more intentional link clicking behavior from users.
Also, when using Website Buttons, we suggest using the “Optimize for website conversions” campaign optimization preference. This will ensure your campaign drives more link clicks from people with a high likelihood to convert.
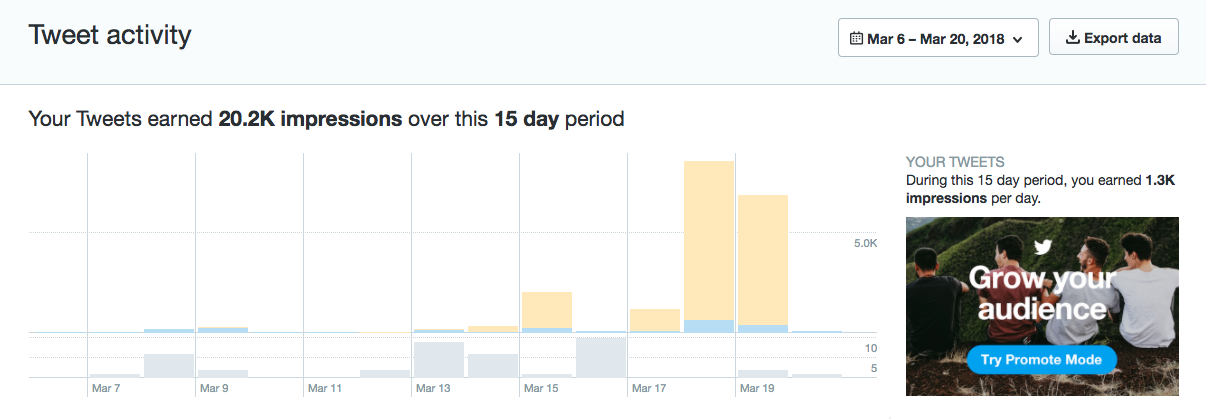
Post and Video Activity Dashboards
Why does my .CSV download show different data than my TAD or VAD dashboard?
The TAD/VAD dashboards, the TAD/VAD post lists, and the TAD/VAD .CSV exports report on three different sets of metrics, which is why comparing them might appear to show discrepancies. It's expected that they show different analytics.
Dashboard
The metrics shown on the top dashboard show ALL activity across your entire account (every single post sent from the beginning of your account's history) during the selected date range. That means if someone reposts or likes a post from November on March 15th, it will be counted in the TAD dashboard metrics for March. All activity that occurred in a given timeframe on all historical posts will be shown on the TAD dashboard for that timeframe.
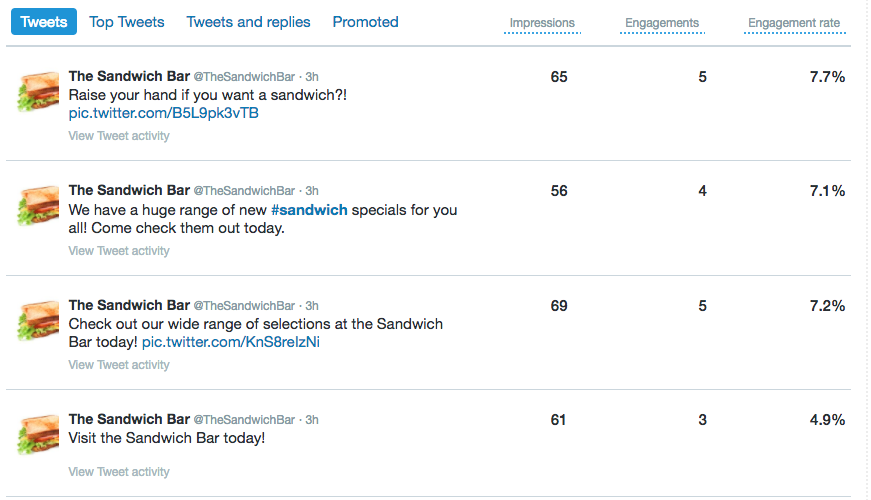
Post list
Only posts that were originally sent during the date range that you have selected will appear in this view. However, the posts shown will display all metrics that they've accumulated since creation.
For example, if you have "Last 7 Days" selected as your date range, only posts that have been posted within the last 7 days will be displayed here. The metrics they show will be the total number of impressions and engagements they've gathered over the course of their life.
Export
The metrics shown on the TAD .CSV ONLY show activity on posts sent during the selected timeframe. (For VAD, it's only for when the video was posted out the first time). That means that if 400 people like a post in April that was posted out in January, none of that will show up in .CSV metrics for April. Only activity that occurred on posts that were posted in that timeframe will show up in a .CSV pull for that timeframe.
Discrepancies
Be sure to note which TAD location you're viewing data from, as they each show a different set of metrics. Here are some things to look out for:
- A post from a past time period is promoted in the current time period, which results in higher TAD dashboard numbers than TAD .CSV numbers.
- A post from a past time period "goes viral", i.e. is reposted by a prominent user or embedded in a high traffic website. This results in higher TAD dashboard numbers than TAD .CSV numbers.
Why can't I see any data in my TAD or VAD?
X Analytics, including the post Activity Dashboard, is a free service available to all X users who have an ads account and/or register at analytics.X.com.
To maintain access to your post Activity Dashboard and Video Activity Dashboard, please make sure:
- Your account has not violated any of our Our Rules and policies
- You are abiding by our organic account best practices policies
- Any promoted content is compliant with our X Ads policies
If you're unable to see data in your TAD or VAD, it's likely that your account has been found in violation in one of the above policies. Learn about how we enforce our policies.
If you still have questions, file a support ticket via ads.twitter.com/help or through our main help center.
Conversion tracking and attribution windows
Why are my conversions not matching my third-party analytics conversion tracking?
Your Ads Manager will report one link click every time someone on X clicks on a link in your post. This is logged as soon as the click action happens.
In third-party analytics platforms, you receive reports on the number of times that unique users land on your webpage (convert), and stayed long enough for the page to load completely (triggering their analytics tracking code).
This is what drives the difference between the two numbers you are seeing. This can vary based on:
- Load time - for example, on slow cell networks, it may take longer for the link to request and page to load, so users may exit out before the webpage fully loads.
- Intent - users may click on an image but exit out when they realize a website is loading.
To improve these numbers, we recommend testing different creative formats, including:
- Picture + link in post copy - try adding an image and a link in your post copy, instead of using Website Buttons. This has increased link click intent in certain cases.
- Only a link in post copy - try using just a link in your post copy. This too has resulted in more intentional link clicking behavior from users.
Also, when using Website Buttons, we suggest using the “Optimize for website conversions” campaign optimization preference. This will ensure your campaign drives more link clicks from people with a high likelihood to convert.
Why is my mobile tracking partner reporting a different number of installs than my ads manager?
In your X Ads account, you can customize the attribution window you'd like to display your mobile conversions to display in. If your conversions reported in your X Ads account don't match that of your mobile app tracking partner, confirm that the attribution window for each conversion in your Tools > Conversion tracking > Mobile app events page matches the windows in your MACT partner dashboard.
Remember, our app install or re-engagement campaigns always bill on a 30-day post-engagement / 1-day post-view attribution window, no matter which attribution window you've set to view your analytics.
Where will my online conversions appear after I've installed my pixel?
After installing our X web pixel on your website or within a container tag, you must also set up a "Conversion event" in the Tools > Conversion tracking tab of your ads account.
Conversion events register a conversion whenever someone fulfills the URL parameters that you set. Each conversion event can be classified as a Purchase, Install, Download, Sign up, or Site visit — whichever you choose when setting up your event.
To see the results of these events, go to "Customize metrics" in your ads manager, and choose which conversions you'd like to see. Learn more about conversion tracking analytics.
Why do my reported conversions change over time?
X reporting is finalized within 24-48 hours of when impressions are served. Before that time, we estimate data to provide real-time feedback, but the data is subject to change. The X conversion reporting UI has two process pipelines to display data.
First, a streaming job directly collects page visits and purchase events from live log data and pulls metrics into reporting. Following that, an ongoing batch process removes duplicate tag fires, adjusts conversion attributions, and handles identity merging for multi-device conversions.
Ready to get started?